Stop treating launch day as the finish line. That's the most popular advice in SaaS, and it's wrong. Votes, comments, and a spike in visits tell you almost nothing about whether anyone will still be using your product in week three.
A SaaS launch strategy is the plan that moves a product from a validated idea to a steady flow of activated users. A SaaS launch strategy covers pre-launch validation and beta testing, coordinated distribution, and post-launch measurement and iteration, plus positioning, pricing experiments, two or three acquisition channels, and metrics tied to first value and repeat use. Launch day sits in the middle of that work, not at the end.
What a SaaS Launch Strategy Covers
Most launches get judged on launch day attention. Actual results show up weeks later, when you can see how many people reached a first useful result and came back for a second one. If you only measure the spike, you'll optimize for noise.
A SaaS launch strategy is a dated operating plan, not a single announcement. Your SaaS launch strategy should answer four decisions in writing. When will you launch. What will you say. How will you price and test the offer. Which numbers will prove the launch worked.
The Four Decisions in Writing
- Timing: Set a launch date only after beta users return on their own and onboarding gets a new user to a first result without your help.
- Message: Write one positioning sentence that names the user, the problem, and the outcome. If the sentence fits any product, it's not sharp enough.
- Pricing: Pick a small set of experiments before launch. Don't redesign your plans every time a visitor complains.
- Proof: Choose two or three channels and track activation by source. A channel that sends signups who never activate isn't working.
Treat the plan as a repeatable playbook, because you'll launch again. Every feature release, pricing change, and new segment needs the same sequence of validation, distribution, and review. Teams that are building a go-to-market playbook can borrow the structure of owned decisions and dated checkpoints, then keep the launch version short enough for a solo builder to run alone.
By the end of this process you should have three things on paper. A dated plan from pre-launch to week four. A positioning draft you can read to a stranger in ten seconds. A metrics dashboard you can start tracking in week one, even if the dashboard is a single spreadsheet tab.
Launch Timeline From Pre-Launch to Week Four
Run the launch in three phases, each with an exit check. The Product Fruits product launch guide describes a launch as pre-launch research and beta testing, coordinated launch distribution, and post-launch measurement and iteration. That sequence is the whole point. Launch day is phase two of three.
| Phase | Timing | Core goal | Exit check |
|---|---|---|---|
| Pre-launch research and beta | 6 to 8 weeks before launch | Confirm the problem and test with a small beta group | Beta users return on their own each week |
| Coordinated launch distribution | Launch day to day 7 | Publish the main asset on every chosen channel and answer feedback fast | Each signup has a recorded source |
| Post-launch measurement and iteration | Weeks 2 to 4 | Find and fix the largest onboarding drop-off | First-week retention and repeat use reviewed every week |
The visual below maps the same three phases against the calendar.
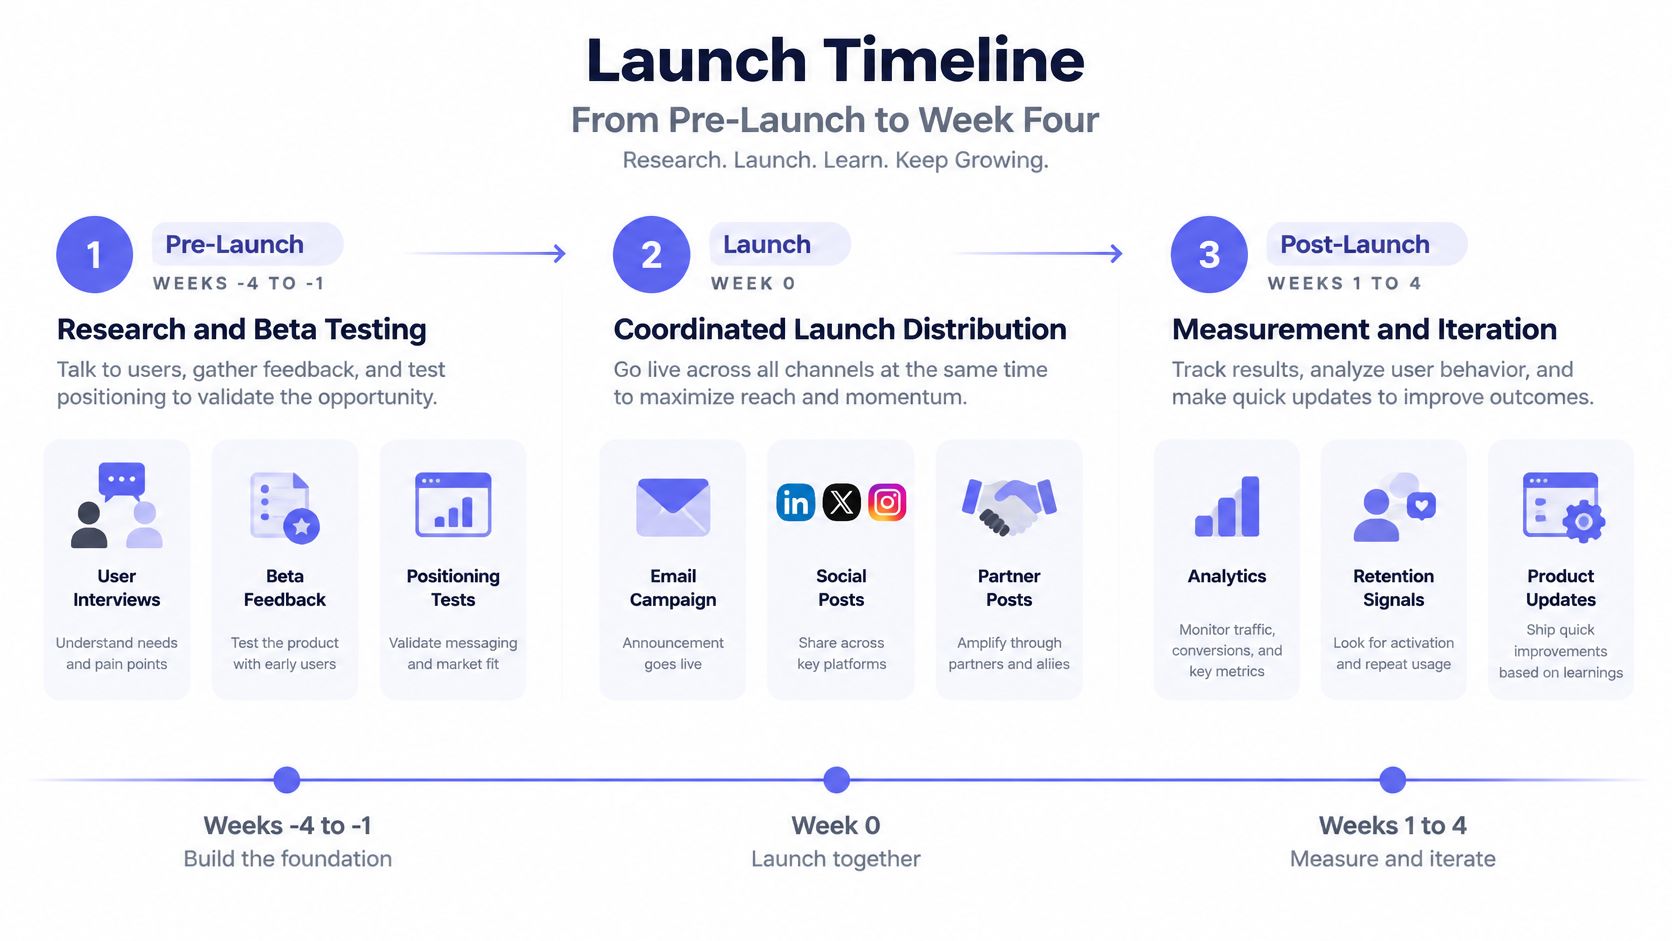
Phase 1 Pre-Launch Research and Beta
Start six to eight weeks before launch day. Interview target users, run a small private beta, and draft your positioning from what people say. Your exit check is behavioral, not polite. Beta users should return each week without you nagging them. If they only show up when you send a reminder, you don't have a launch yet. You have a courtesy audience.
The usual slip in this phase is skipping the beta entirely and treating friends as market proof. Friends are kind. Strangers who pay with their time are honest. Recruit beta users from the exact situation your product serves, give them one job to complete, and watch where they stall.
Phase 2 Coordinated Launch Distribution
Launch day through day seven is a distribution sprint. Publish your main asset across the channels you chose, answer every comment within hours, and log where each signup came from. Speed matters here because early questions reveal the objections your page failed to answer. Write those objections down word for word. They become your week two copy fixes.
The slip in this phase is spreading across too many channels. A solo builder posting in ten places answers nobody well. Pick two or three channels, show up properly, and tag every link so you can compare activation by source later instead of arguing from impressions.
Phase 3 Post-Launch Measurement and Iteration
Weeks two to four are where the launch is won or lost. Review drop-off in onboarding, fix the single largest friction point, and adjust messaging for the segment that activates fastest. This is also where you read the post-launch week checklist and compare your numbers against your exit checks, not against your launch day mood.
The slip here is declaring success from launch day votes. Votes don't renew subscriptions. Track adoption, collect feedback, and change one thing at a time based on observed behavior.
Rule of thumb: Don't start paid acquisition until your onboarding path already gets a cold user to a first useful result. Paid traffic into a broken funnel just buys disappointment faster.
Validate Demand and Sharpen Positioning Before You Build
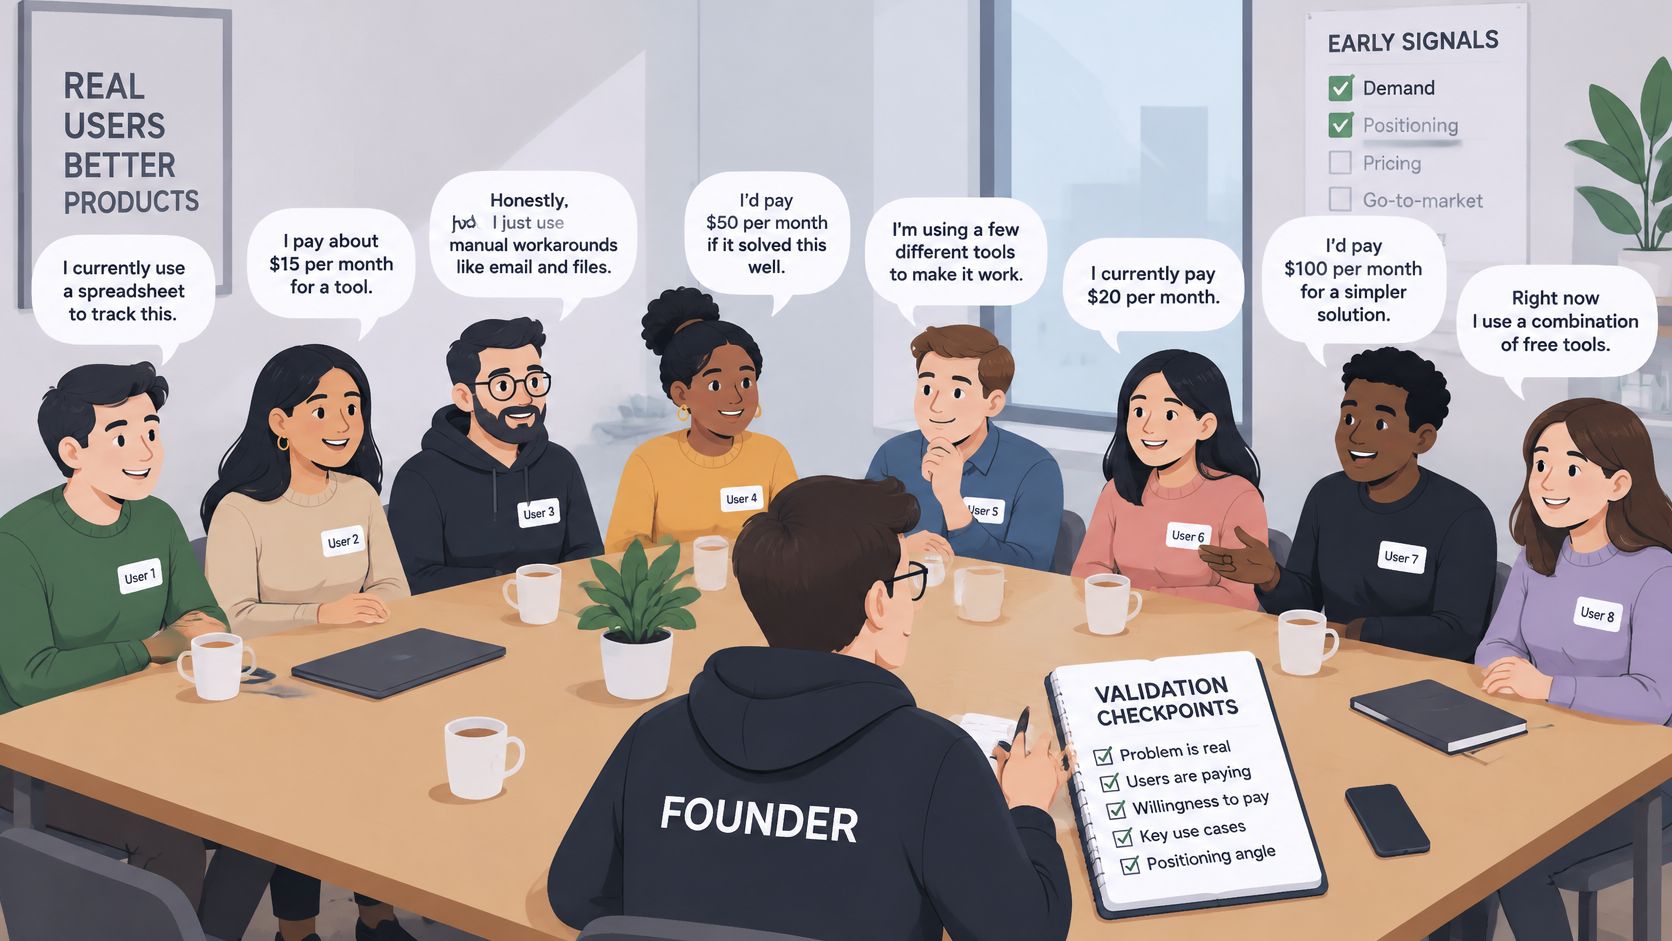
Validate before you build substantially. The Crisp startup product launch guide recommends 7 to 10 deep interviews with people in the target market before heavy development. Ask about the current workaround, what they paid for the workaround, and what would make them switch. Opinions are cheap. Past spending is evidence.
The same framework gives you two beta thresholds. Fewer than 20% of beta users active weekly is a warning sign. 40% or more saying they would be very disappointed without the product is a positive signal. If you're below the first line, stop adding features and find out why people don't return.
The photo below shows the unglamorous version of this work, which is where real positioning comes from.
The Positioning Routine
- Write the problem in the customer's words. Lift exact phrases from your interviews. Don't translate their language into your category jargon.
- Name the audience by role and situation. "Solo founder launching a first SaaS product" beats "startups" every time.
- State the outcome in one sentence. Add a number if you have one. If you don't, leave the number out.
- List the alternative they use today. Your real competitor is usually a spreadsheet, a manual process, or doing nothing.
- Write the one feature that makes the outcome believable. One feature, not a feature list. The rest is supporting detail.
Watch the difference in a simple example. Weak line for a team collaboration product: "A better way for teams to work together." Sharp line: "Support leads at small SaaS companies clear their shared inbox before lunch, without assigning tickets by hand." The second line names a person, a deadline, and a removed chore. A reader can instantly say whether the product is for them.
If you want a structured way to test whether those interview answers add up to real demand, the process to validate B2B product market fit is a useful companion to the thresholds above. Use the thresholds as the decision, not as decoration.
If fewer than one in five beta users shows up weekly, you don't have a marketing problem. You have a product problem wearing a marketing costume.
Close this phase with a hard decision. Keep building if the disappointment signal is strong but onboarding is rough. Revise the product if weekly activity is weak. Launch when users return on their own and can describe the outcome back to you in their own words.
Activation and Retention Benchmarks to Track
Define activation as a behavior, not an account. A signup is a promise. Activation is the moment a user gets the first meaningful result your product exists to deliver. For a reporting tool, that's a finished report someone opens. For a scheduling tool, that's a booked meeting. Write your version down before launch, or you'll move the definition later to flatter the numbers.
The growth SaaS benchmarks compilation, drawing on a 2022 survey of more than 500 products, reports an average activation rate of 36% with a median of 30%. The same compilation puts average week-one retention for active users at 28%. Translation: about one in three signups should reach first value, and most of the rest will be gone inside a week unless onboarding does real work.
| Metric | What it measures | Reference benchmark |
|---|---|---|
| Activation rate | Share of signups reaching the first meaningful result | Average 36%, median 30% |
| Week-one retention | Share of active users still active after seven days | Average 28% |
| Time to first result | Hours or days from signup to first useful output | 14 days or less |
| Day-30 repeat use | Share of users who return for a second campaign within 30 days | Track weekly against your own week one baseline |
| Channel activation split | Activation rate broken down by acquisition source | Keep channels that beat your blended rate |
A separate dataset tells a sharper story about speed. The time-to-value benchmark covering 62 B2B SaaS companies reported median activation of 37.5%, and users who reached first value within 14 days kept at least 80% retention at month 12, versus roughly 35% to 50% when first value took more than 30 days. That's a different dataset from the 30% median above, so don't blend the two. The lesson is simple. Set your first-value target at 14 days or less, and work backward from there.
How to Read the Numbers
Use a two-branch rule. If activation sits below the 30% median, fix onboarding before you add traffic. More visitors into a leaky first run just produces more churned accounts. If activation is healthy but week-one retention is low, your first result is fine and your repeated value is weak. The product works once and gives nobody a reason to come back.
Instrument each stage separately so you know which branch you're in. Track signup, first action, first result, and second use as distinct events, then split each one by channel. The product launch metrics breakdown is a good reference for setting up that event list before launch day, not after.
Every Monday during launch month, review three numbers and nothing else. Activation rate. Week-one retention. Median time to first result. If those three move in the right direction, the launch is working, whatever the vote count said.
Pricing Experiments to Run Before and After Launch
Start with the free entry choice, because almost everyone offers one. The product-led growth statistics compilation reports that 57% of products begin new customers on a free trial, 26% use freemium, and 7% use a reverse trial, so roughly 90% provide some free entry point. The same compilation cites Harvard Business Review research placing typical free-to-paid conversion at roughly 2% to 5%, with free users worth about 15% to 25% as much as premium subscribers, partly through referrals. Low conversion isn't failure. It's the normal shape of a free funnel.
| Experiment | What to vary | Success metric | Decision rule |
|---|---|---|---|
| Headline promise | Outcome wording against feature wording | Qualified visit to signup | Keep the wording that lifts signups without lowering first use |
| Free allowance | Number of free outputs before a paid plan is needed | Free to paid conversion | Keep the allowance that still leaves a clear reason to upgrade |
| Billing cadence | Monthly against a campaign-style plan | Paid conversion and 30-day churn | Keep the option with better retention after 30 days |
| Watermark policy | Watermarked against clean output on free use | Downloads and second use | Keep the policy that increases repeat use |
| Sample output on pricing page | Which example result is shown | Pricing page to signup | Keep the sample that matches what new users actually build |
Before you rewrite your plans, test the page. The SaaS pricing page design benchmark synthesis reports that qualified traffic on well-designed SaaS pricing pages can convert at approximately 15% to 30%. If your page converts far below that range, your problem is probably clarity, not price. Show the output, the limits, and the input requirements so a visitor can judge value without a sales call.
The One Trap to Avoid
An offer that raises signups but lowers successful first use or repeat use is a bad result, even when the top-line number looks great. Judge every experiment on the full funnel, from qualified visit to second use to paid conversion. Signup volume alone will lie to you.
Low traffic isn't an excuse to skip testing. Pick the change with the largest expected effect, keep the test window fixed, and read results by source and device instead of one blended number. For the free allowance, use this rule. End the free tier at the moment a user has seen a real result and wants more volume or scheduling, not at the moment they first see the product.
Practical limit: Never change more than one price-facing element in the same two-week window. If two things change and conversion moves, you've learned nothing.
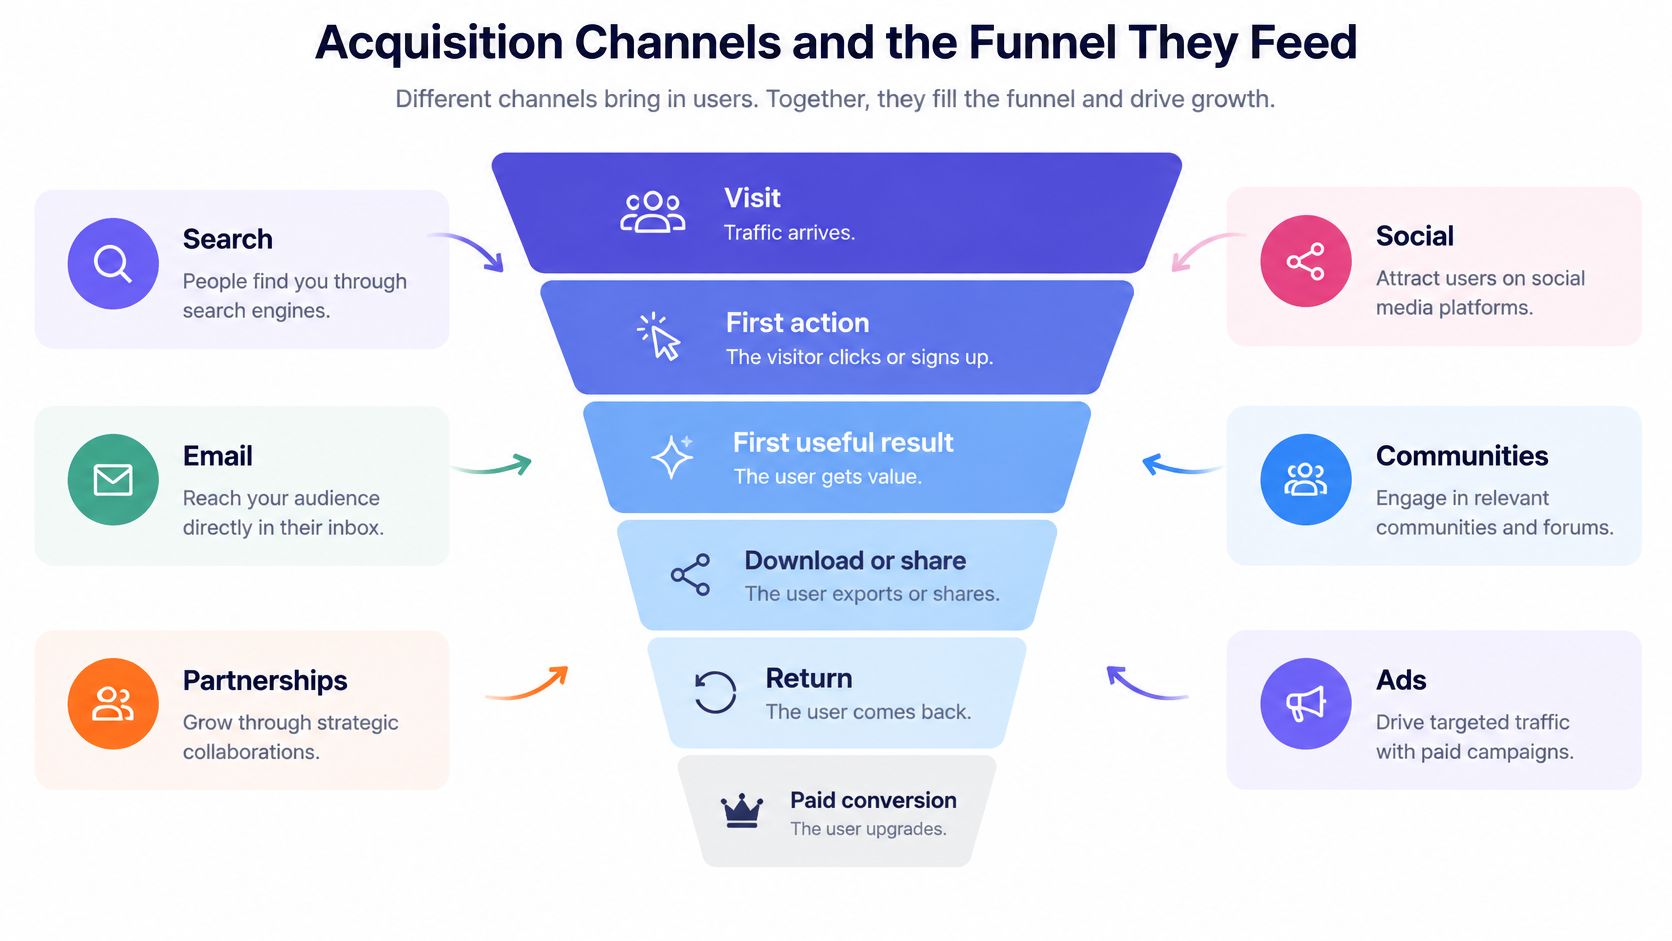
Acquisition Channels and the Funnel They Feed
Every channel feeds the same funnel, so learn the funnel first. Visit. First action. First useful result. Download or share. Return. Paid conversion. A channel is only good if its users move past the first useful result. Cheap traffic that never activates is expensive traffic.
The diagram below shows the six channels feeding those stages.
| Channel | Best use | Effort | Signal to watch |
|---|---|---|---|
| Product Hunt launch day | Spike of first-day visitors for a finished product | High for one day | Qualified signups in the first 48 hours |
| Owned launch page with email | Capturing visits from every other channel | Lowest cost | Conversion from visit to first action |
| Founder posts on X and LinkedIn | Reaching people who already follow the problem | Medium | Replies from target users |
| Short-form video | Showing the product result in under 15 seconds | Low with a teaser | Completed watches and profile visits |
| Niche community posts | Finding people with the exact problem | Medium | Quality of the questions asked |
| Paid ads | Scaling a channel that already converts | High spend | Only after onboarding delivers a first result |
Video earns its place in this list because it does several jobs at once. The HubSpot video marketing statistics roundup reports technology marketers using video to explain complex products at 49%, improve brand awareness at 39%, generate leads at 29%, launch a product or service at 27%, and increase conversion rates at 17%. A short, silent teaser built from your product page fits the launch and short-form slots because a viewer can understand the result with the sound off, which is how most feeds get watched.
How to Choose Your Two Channels
Start where your target users already spend time, not where posting is easiest for you. If your buyers live in niche communities, one honest community post with a real result beats a week of broadcast posts. If you plan to build a SaaS outbound pipeline later, treat outbound as a scaling move after your message converts inbound visitors, not as a substitute for a message that works.
Compare options against your own calendar using the guide to where to launch your product, then commit. Two channels, tracked separately, with source tags on every link. Kill the channel whose users don't activate, even if the channel sends the most visits. Visits are not the goal. Activated users who return are the goal.
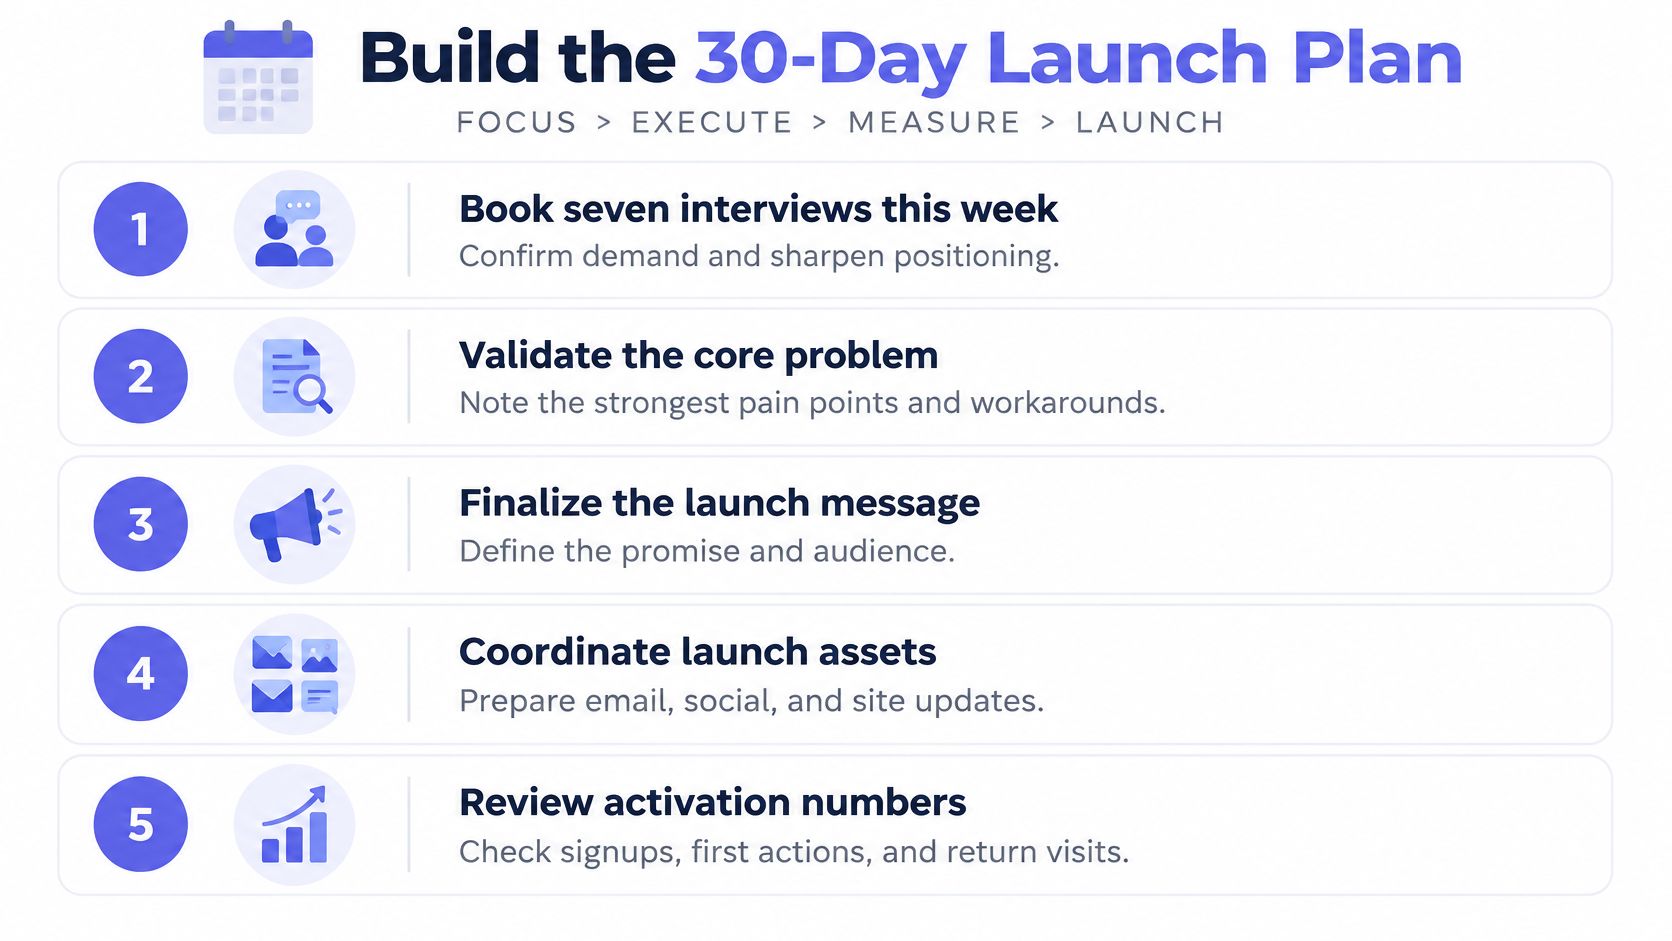
Build the 30-Day Launch Plan
Commit to a 30-day plan that starts with validation and ends with reviewed activation numbers. Not a launch day. A month with dates.
The checklist below puts the five moves in order.
- Book seven interviews this week. Ask about the workaround and what people paid for the workaround.
- Write the positioning statement and test the statement on three users. If a user can't repeat the outcome back, rewrite the statement.
- Set up activation events and source tags before launch day. Pair the setup with your launch email sequence so every send points at a tagged link.
- Choose two channels and one video asset. One asset, posted well, beats five assets posted badly.
- Set fixed review dates in week two and week four. Put the dates in the calendar now, while you're still honest.
For the video asset, be clear about what fits. ShipTeaser turns a product URL into a 15-second, 1080p, silent motion-graphics teaser in about 2 minutes, built on five scenes (hook, problem, solution, proof, CTA) and ready in 16:9, 1:1, or 9:16. Silent means no voice-over, though an optional music bed is available. ShipTeaser is built for launch content, not for performance ad creative with actors or hook variants, so ShipTeaser suits the launch day asset rather than paid campaign testing. The first video is free with no credit card, and paid plans run $99 per month for 1 video per week, $149 for 2 per week, or $199 for 4 per week, with no setup fees and cancellation at any time. Any public page can be used, including a landing page, a product page, or an app site.
Do one thing today. Write the sentence that names your user, the problem, and the outcome. Then check the sentence against your interview notes and cut every word your users never said.
FAQ
How Long Should a SaaS Launch Take From Start to Finish
A SaaS launch should run about ten to twelve weeks end to end. That means six to eight weeks of pre-launch research, interviews, and beta testing, one coordinated launch week, and a four-week post-launch period where you review activation and fix the largest onboarding drop-off. A founder who only plans launch day is planning the middle of the work.
How Many Beta Users Are Enough
Start with 7 to 10 deep interviews, then judge the beta by behavior instead of headcount. Fewer than 20% of beta users active weekly is a warning sign, while 40% or more saying they would be very disappointed without the product is a positive signal. Twenty engaged beta users who return weekly beat two hundred silent signups.
Should a Solo Builder Launch on Product Hunt
A solo builder should launch on Product Hunt only when onboarding already delivers a first useful result without help. The builder also needs to answer every comment within hours on launch day and tag links so each signup has a recorded source. If the product needs hand-holding to reach first value, fix onboarding first and launch later.
Which Metric Matters Most in the First Month
Activation rate matters most in the first month, because activation shows whether new users reach the first meaningful result. Week-one retention comes second, because retention shows whether that result is worth repeating. A launch with strong activation and weak retention has a product that works once. A launch with weak activation needs onboarding fixes before more traffic.
Paste your product URL into ShipTeaser and get a 15-second, 1080p silent teaser in about 2 minutes, ready to post on launch day in 16:9, 1:1, or 9:16. Your first video is free with no credit card, so make the asset today and spend launch week answering users instead of editing video.